How to Create bingAds Reports in Google Analytics, Part 2
 Wednesday, February 19
 This is the second in a series of "how to" posts for uncovering actionable insights in Google Analytics for your bingAds PPC campaigns. Part 1 is here.
Now that you've properly installed UTM tags on your bingAds destination urls, let's review how to access campaign visits and information in Google Analytics. Once you become familiar with all of the information catalogued in Analytics, you'll have fun manipulating reports to access the exact data needed to make strategic bid and budget decisions.
How to create the best Bing PPC reports in Analytics:
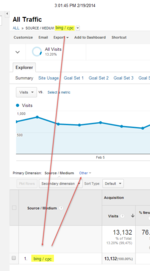
The first thing to understand is that with the proper source and medium UTM tags, you'll immediately start to gather bing / cpc data (previously lumped in with bing / organic) in the Acquisition>All Traffic report like this:
To start creating a report with Campaign level insights, just click on bing / cpc (or msn / cpc, depending on your source tag) from the Acquisition>All Traffic report to explore that dimension further. Your report will look like the following, and you'll be able to select "other" to start customizing your report:
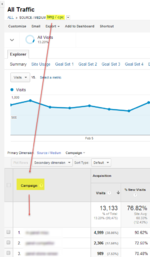
 Click to view a larger imageChoose the Primary Dimension dropdown menu "Other" and type/select "campaign". Your report will now look like this:
 Click to view a larger version
Next, follow these 4 easy steps to create a pivot table report showing Campaign visits and Per Visit Value by new vs return visitors
- Click the blue Ecommerce link above the Explorer Graph
- Click the pivot icon (far right icon below graph and above the Per Visit Value column of data)
- Select "pivot by" visitor type (far left dropdown above the Campaign column)
- Select "pivot metrics" for "visits" and "per visit value"
Your bing / cpc campaign report should look like this:
In our example, the first campaign drives significant traffic but low conversion and low Per Visit Value ($0.61). This campaign is our "discovery/top of the funnel" campaign. As long as it's returning visitors for a 2nd look to continue their exploration of our client's site, we're happy. But the return rate is only about 10%, so we need to keep bids below our average Max CPC.
The second campaign is comprised of highly relevant, longer-tail keyords that indicate buying intent. Note the higher Per Visit Values for both "new" and "returning" visitors on this campaign at $1.6 and $4.07 respectively.
The third campaign is comprised of "alternate" long tail keywords and rarely converts on the first visit. This campaign introduces visitors to a different type of product and solution than what they may have originally envisioned when searching on bing.com or yahoo.com. Almost 30% of the visits related to this campaign are "returning" and it has one of the highest Per Visit Values of any of our campaigns.
With this information, we can identify campaigns that are high in value and determine if there may be value in increasing our bids and budgets, or perhaps testing similar but slightly broader keywords. The reverse is true for campaigns that drive a lot of visits (which translate to clicks an cost) but poor "returning" rates and low "per visit value".
Important! Once you have your data configured in a manner that is meaningful to your project and analysis, just click the "Shortcut" button above the Explorer tab and save with your desired naming convention. The next time you want to analyze this data, all you have to do is click on the report in your "Shortcuts" area in the left hand navigation
A note on Per Visit Value. This metric is simply the result of dividing each campaign's revenue by visits. We find it extremely valuable in understanding how well (or poorly) any particular campaign (or keyword for that matter) performs. For lead gen (not ecommerce) websites, as long as you have a value associated with your Goals, you can access similar insights using the "Goal Set 1", etc. links above the graph.
Pro tip:
Let's say you like this report but want to see data for visitors by Region (aka "state" for USA). Change your "pivot by" to "Region". You can further drill into just "returning" visitors by applying an Advanced Segment (you'll probably want to close the "All Visits" segment) like this:
Your pivot table will now show only "returning users" by campaign and region. This information can help to identify regions to exclude from your campaigns or regions that warrant an increased bid multiple. Note that each metrics column under each region can be sorted ascending/descendng:
Need help with your Analytics reports? Contact Us for help or questions!
 advanced segments,
  bingads,
  google analytics,
  pivot tables in
  bingAds
 CONTACT US


